Ethereum (ETH) price weekly insights for the week commencing 16th September 2019. Fresh crypto markets content every week, so stick around.
Ethereum (ETH) seems to be a mystery to some traders and investors. At least in terms of its price movement on certain chart time frames. Huge corrections are followed by lethargic lack of liquidity. In such occasions, my experience taught me to look at big time frames on the chart. That’s exactly what I did for this week’s Ethereum market analysis.
Looking at the weekly chart below, we may spot a sharp trend-like peak on the left followed by an equal trend-like correction that brought the Ethereum price back close to the point at which the movement initially started, around USD 75. I have seen such corrections on stocks price charts. The price surges up just to plummet down again. In this instance we may talk about what’s called a Christmas tree pattern. In this respect, I would not be surprised if the price falls once again and hits the USD 75 mark (the yellow circle), where Ethereum has already received support in December 2018. In order to hold its level in the coming months and not be considered a mayfly, the price of Ethereum needs to exceed the USD 362 high (circled in green) to meet the uptrend criteria. Possible target in the longer run would then be the yellow line in the USD 831 range. Since we should certainly wait a little longer to validate such development, we may now start looking at smaller time frames on the chart.
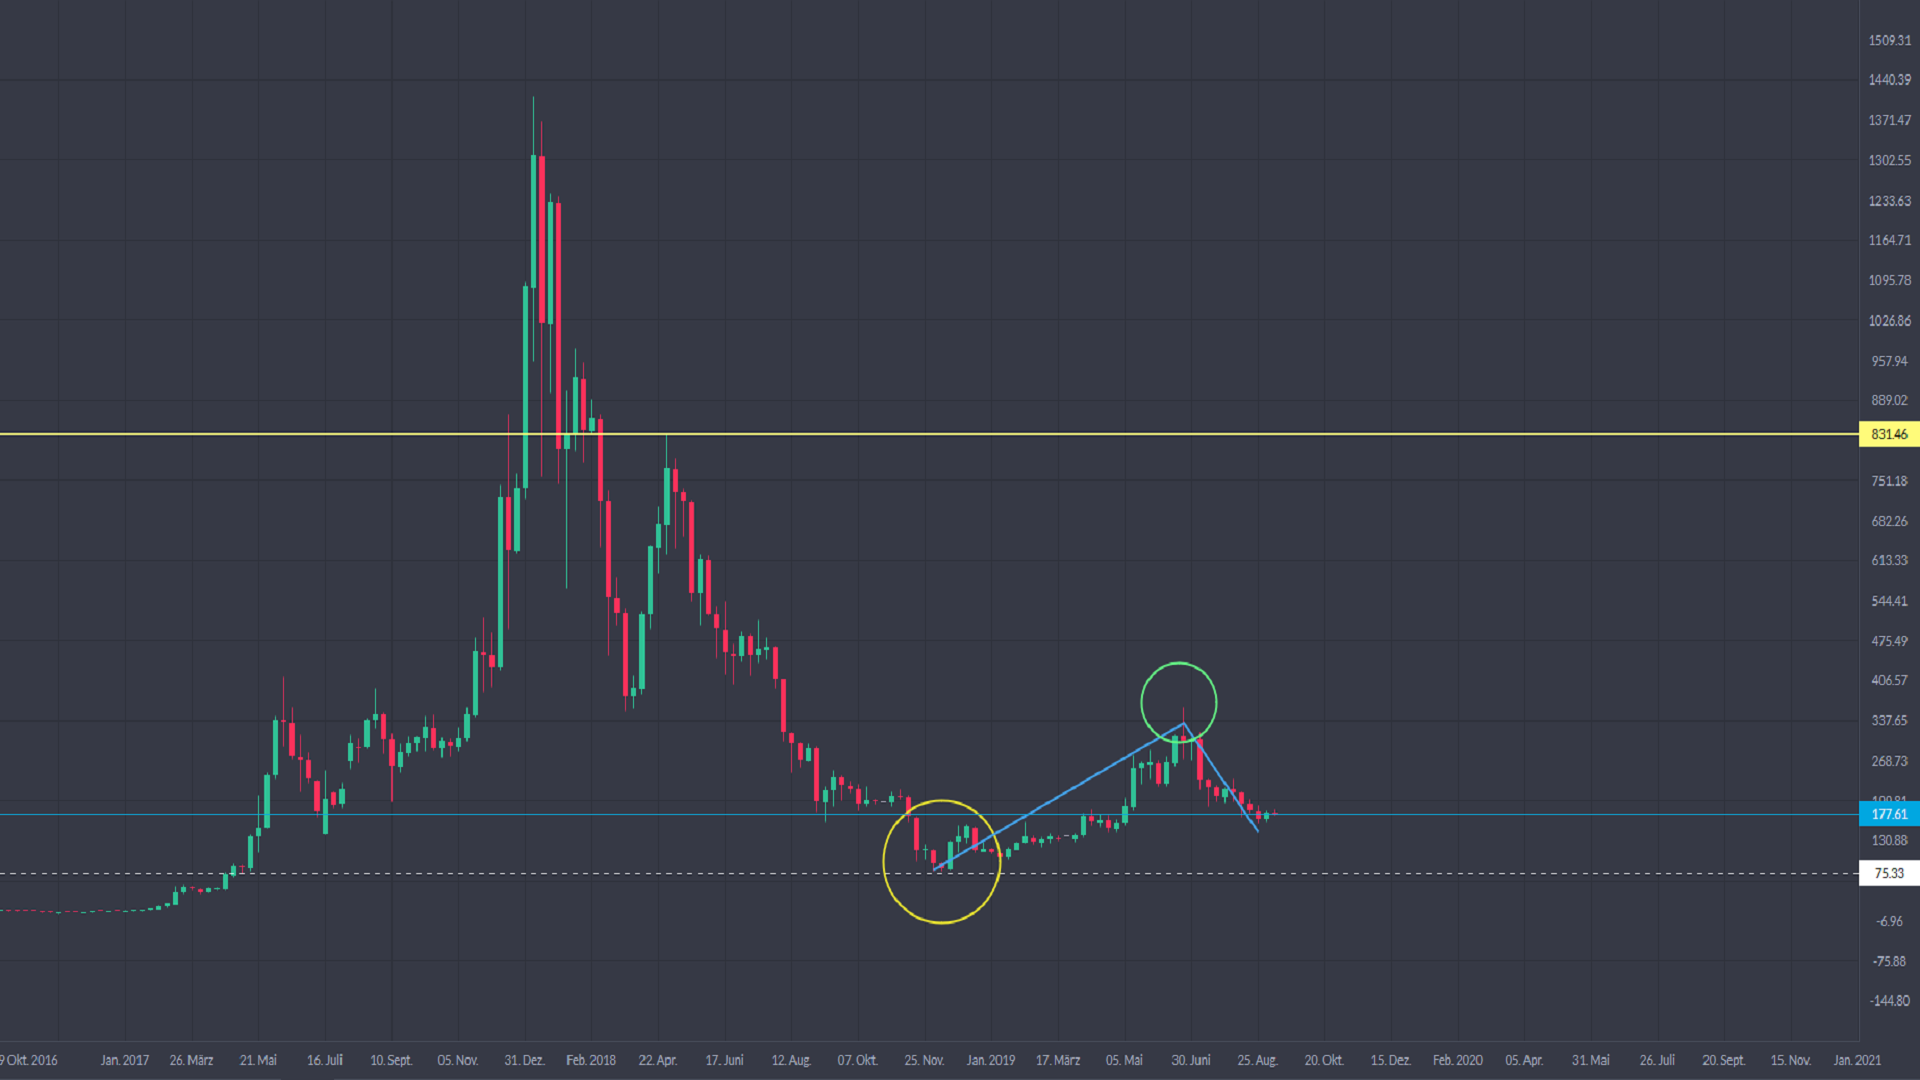
Weekly chart (1-week Chart)
The 4-hour chart clearly shows that Ethereum is currently struggling to recover. While at first glance the price action may suggest a sideways movement, which is quite correct, we may also see that a downtrend still holds the supremacy (pointed out with blue lines). The sideways movement was merely range bound, caused by the candle formed on 28th August (circled in yellow) when the price slides. My experience leads me to believe that after touching the top of the candle the Ethereum price may go back into the short direction. Such movement would not surprise me at all. Only a sustained break from this pattern may bring a new impetus, most probably bullish in my opinion. Until then, the price is most likely to continue this volatility course on the smaller time frames.
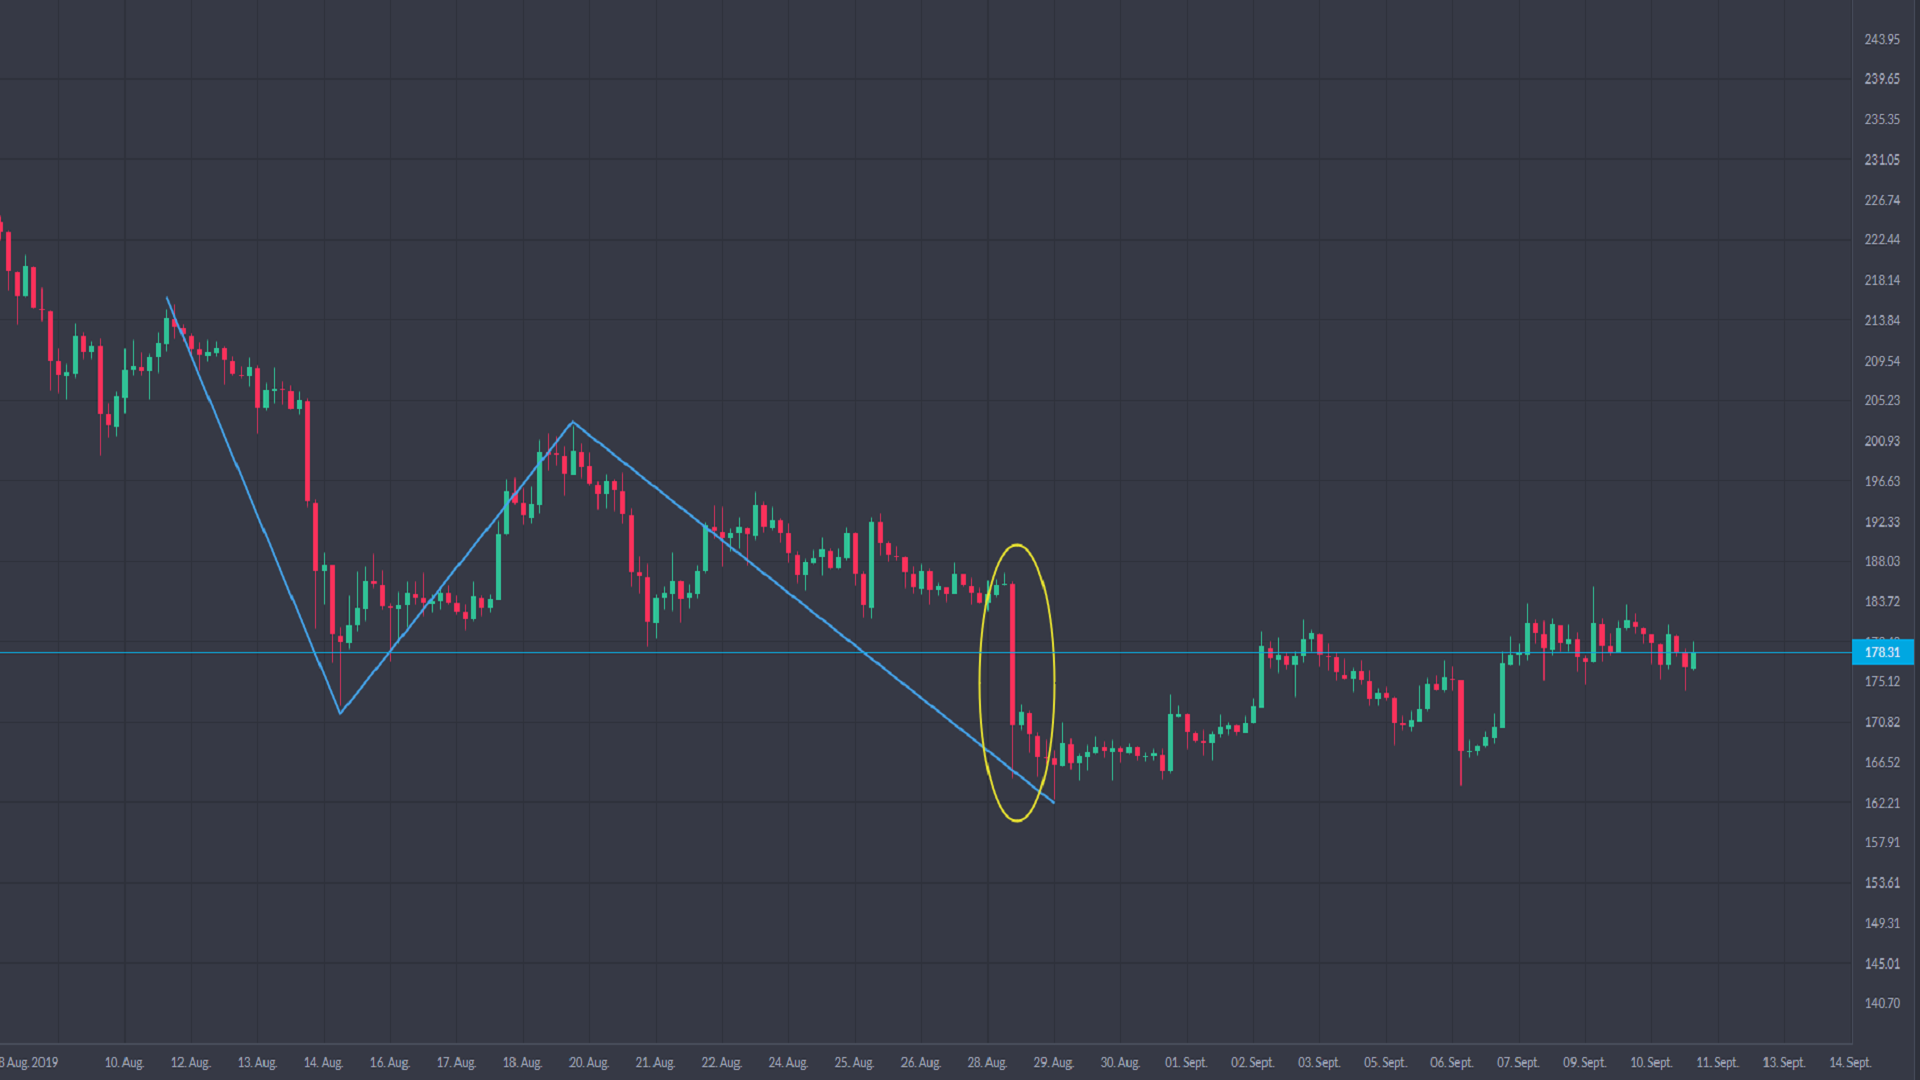
Four-hour chart (4-hour chart)
What happens next with Ethereum? What will be the next significant move? Share in the comments below. Watch this space for more weekly crypto market analyses – get on board on Twitter, Facebook, and LinkedIn today.
This market analysis should not be construed as investment or trading advice, nor a recommendation. It represents the author’s sole opinion. Prices should be considered indicative and may differ across market data providers. CoinChoose.com could not be held liable for any loss incurred by using this information.
Chart images: Trading 212